25. März 2016
Air Pollution – Green, Yellow, Red: Toying with CleanSpace
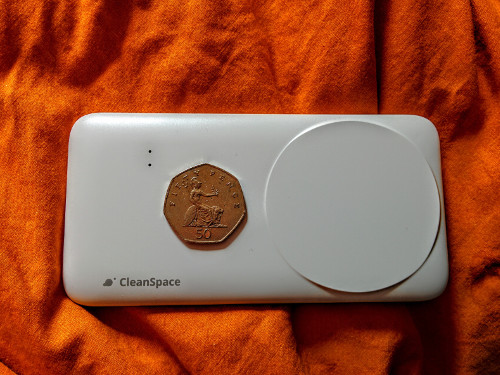
 Got the CleanSpace tag delivered. It is a RF-powered, portable device measuring carbon monoxide concentration. I spent a few days playing with it, and sharing my first impression here. Ultimately, I want to know whether the data can help foster change to the better.
Three days ago, I received a CleanSpace tag, as anticipated in this article. I am still in the early phase of playing with this new gadget and see what I can do with it.
The principle is fairly easy. Carry the CleanSpace tag around, and the sensor will measure your exposure to air pollution. The tag is fairly light (51g according to the producer) and roughly of the size of a smartphone, which makes it bulky enough for me not to carry it in my pockets. The good thing is the weight does not matter for me when either walking, cycling, or running. I routinely do these activities with backpack anyway, so it is not really a problem.
The tag is paired to my phoneand the CleanSpace app via Bluetooth. It is self-charging by harvesting the energy from WiFi/GSM band; it is quite fascinating that with today’s technology, it is possible with to power a sensor and the connection with the RF energy received by a fairly small rectifying antenna built into the CleanSpace tag. I haven’t collected any evidence but it is likely that running the app and having Bluetooth enabled on the phone sucks energy from its battery; and the phone is not self-charging and unlike the old times where your brick would keep its battery for two weeks, that is a problem even if you are not interested in watching cat videos on YouTube 24/7. In any case, I don’t have yet another device I need to charge, which would have been a deal-breaker.

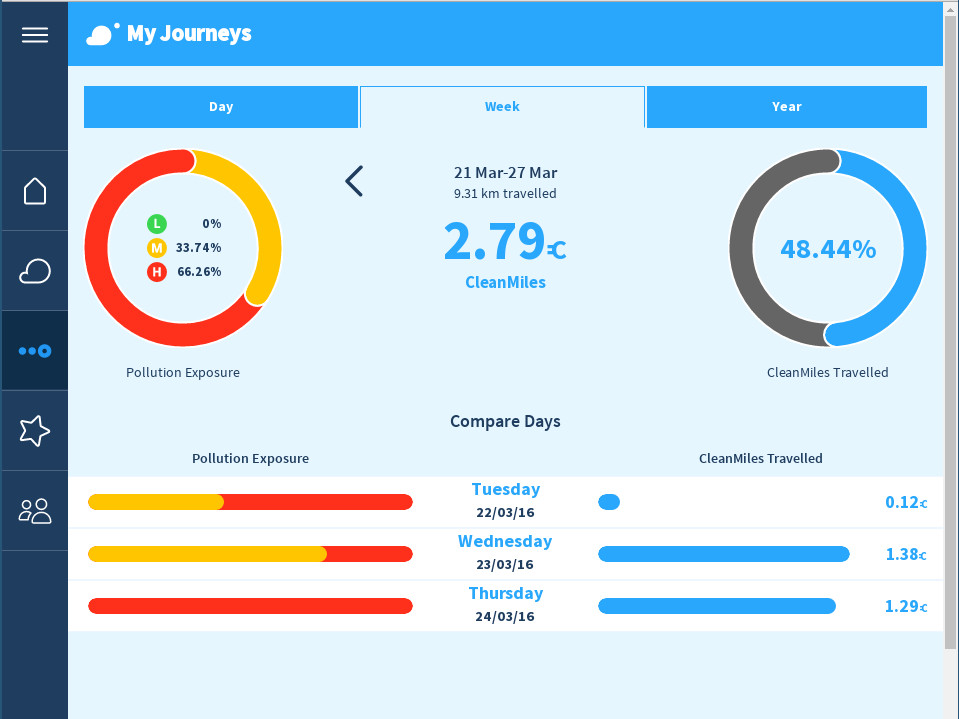
The technical aspects covered, let us have a look at the data itself. The app and the web site allow you to get an idea of your exposure to air pollution over the days, weeks, year. In the three days while using the tag, I spent the majority in the high pollution sector. Well, hang on. What does high mean anyway? The CleanSpace FAQ tells me that
The medium to high thresholds in the CleanSpace App Air Graph have been chosen in relation to the World Health Organisation guidelines of an average limit for 8h exposure to carbon monoxide of 10ppm. The low to medium threshold in the App corresponds to 1.5ppm.
Also the FAQ informs me that carbon monoxide usually correlates well with other pollutants, so while measuring carbon monoxide only, the data is supposed to be a good indicator for exposure to other pollutants as well.
A funny thing I noticed was that the air quality map showed a sharp boundary in reported air pollution at the M25 (this is a monstrous orbital motorway around London). I learnt from the FAQ that the air quality data in London currently comes from the Environmental Research Group at King’s College, London University, and from DEFRA for the rest of the UK. This explains the boundary.
Generally, I would love to see the CleanSpace app and website make it easier to get a picture of how the measurement process works, links to relevant research and findings on health impact, explanation of the various pollutants, and so on. I don’t really expect them to do the research for me, just facilitating it. The FAQ is extensive but having one place to start and read to become familiar with the subject would be great.
In overall, the positive impact is that I started learning more about the problem, and that over time I will have access to more data and insights. I’ll keep using the tag and gather some more experience with it, pulll together a few more sources on air pollution and its consequences. I’ll be back.