7. August 2023
Using Strava segment efforts as benchmarks: heart rate versus running speed
 How to find out whether my training is effective? A casual investigation into whether I can use frequent Strava segment efforts in order to see whether the ratio of heart rate versus speed shifted between two training seasons. The results look promising.
In my previous post (A computer scientist’s attempt at tracking the effect of training without testing) I mused about how to get some objective feedback. How do I know whether the hundreds of hours of training had any effect?
Hence, I explored the following idea (not mine): if I am able to run the same segment at the same speed, but at a lower heartrate, then my training had some effect. Or conversely, if I am able to run the same segment faster whilst keeping the same heartrate, then my training had some effect. Conveniently, to this end, I can pick Strava segments that I have run dozens of times each year.
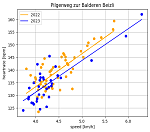
In April, I used Looker Studio to plot heart rate against speed, along with a trend line (linear regression using the sum of least squares). However, this approach had some shortcomings: I found it difficult to compare the efforts in 2022 against the efforts in 2023 because I had a separate plot for each year. We can do better!
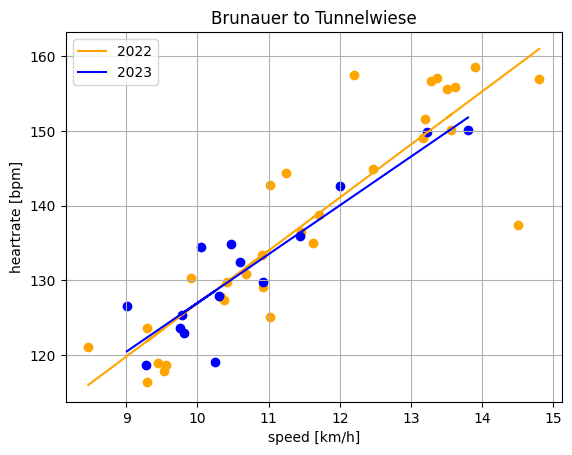
Let’s draw heartrate against speed for each year (2022 vs 2023) into the same plot. Include a linear regression line (least squares) for each year. Then it becomes visually apparent if there was a downward shift (good, usually) or an upward shift (bad, usually). As a caveat, I did not compare year-to-date periods, but I don’t think it makes a huge difference. Here is what I found…
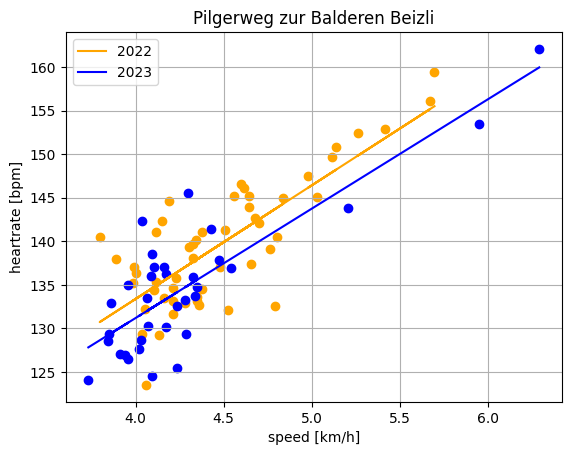
For instance, let’s have a look at a steep (20.8%) uphill segment (“Pilgerweg zur Balderen Beizli”), which I speed-hiked 52 times in 2022 and 34 times in 2023 so far. At 140.0 bpm, I was able to hike up the segment at 4.5 km/h in 2022. In constrast, in 2023, I could keep the same speed at 137.5 bpm.
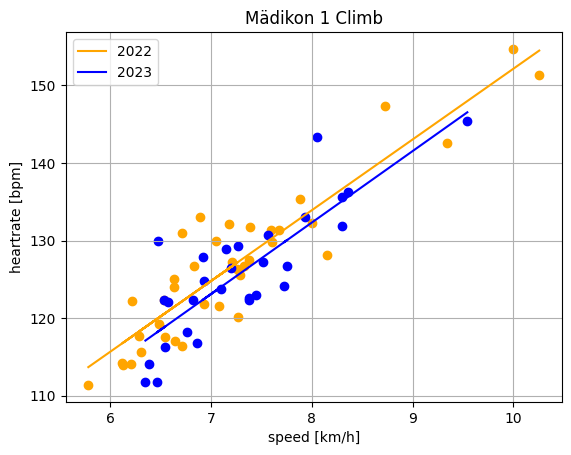
On a less steep (6.4%) uphill segment (“Mädikon 1 Climb”), my heartrate hovered around 124.8 bpm at the humble speed of 7 km/h in 2022. This year, the fitted regression model predicts 123.1 bpm at the same speed. The difference on this gentle uphill segment towards Mädikon appears smaller than for the steep uphill section up to Balderen Beizli.
Finally, there’s a gentle (-0.4%) downhill section (“Brunauer to Tunnelwiese”) on which I have fewer efforts, and thus less data. No difference is apparent here between 2022 and 2023.
From these three Strava segments, it appears that my heartrate has dropped the most on the steep climb, less on the gentler climb, and remained unchanged on the flat/gentle downhill segment when comparing 2023 to 2022. When I look at my training volume, there might be an explanation: in 2023, I have climbed 59.5 km (+47.8%) to date compared to the respective previous period in 2022 (40.3 km). In contrast, in 2023, I covered 368 km (+6.1%) to date compared to the previous period in 2022 (347 km). The increase in training volume in 2023 was mostly in terms of elevation gain. No wonder if that translated more into better abilities in walking uphill than speeding along flat sections.
I don’t think that these cheap benchmarks based on Strava segments will ever tell the whole story. Instead, they are but a few additional data points that help me understand my training effort and what effect my training has. In any case, I love wiggly lines, pretty charts, and sticking my nose into data. This is what I certainly got from using Strava segment efforts as benchmarks, plotting heart rate versus running speed.