25. Dezember 2020
Visualizing Strava activities with BigQuery and Google Data Studio
 How to load Strava activities into Google Cloud BigQuery and visualizing the activities with Google Data Studio? This article is for (hobby) athletes interested in taking a walk through the Strava API, Google Cloud Platform and Google Data Studio; showing how to gain the freedom to explore and visualize the data you have been sweating for over years.
Why
Why do I want to visualize and explore Strava activities? Why are you? Strava is an online service allowing athletes around the world to track their exercise activities, foremost running and cycling. I am a Strava subscriber, and happy enough to pay for the premium account. Why track my activities, particularly if running is just a hobby? Well, precisely because it is just a hobby into which I will only ever invest a limited amount of effort and time. Thus, I expect that tracking can help me to continuously invest into that hobby (because running is more fun, if you keep at it), to be able to bring ambition to the hobby (within the effort and time I allocate, I want to reach my best), and to understand how I integrate the sports with other areas of life (such as work).
Tracking alone─that is gathering data─is not enough because collected data lies around, and when I do not do anything with the data, it may as well not exist. It is only when I look at the data from the right angle that I will ever gain an insight. While Strava is offering canned reports about past activity, Strava does not provide reports that answer the specific questions that I have, e.g. how my exercise habits change over the years. Therefore, I want a way to explore and visualize my activities in a flexible way that meeds my own needs.
What
Now you know why I want to have a way to flexibly explore and visualize my Strava activities, let us discuss what we can do in order to accomplish that. But now, let us look at a couple of alternative approaches. I have no ambitions to give you a comprehensive list of alternatives, but rather show you the two alternatives I have explored before implementing my own solution.
The first option is to use Google Colab, fetching the activities from Strava directly from the Colab notebook using either the Strava API or by uploading a CSV file with activities (see Strava Bulk Export), exploring the data using Pandas and finally visualize the data using Matplotlib. This options provides a lot of flexibility, but it is less convenient if you want a regular report. If you are interested, check out some of my earlier posts where I had taken that approach:
- Analysing Strava activities using Colab, Pandas & Matplotlib: Part 1
- Analysing Strava activities using Colab, Pandas & Matplotlib Part 2
- Analysing Strava activities using Colab, Pandas & Matplotlib Part 3
- Analysing Strava activities using Colab, Pandas & Matplotlib Part 4
- Applying Machine Learning to Strava activities using BigQuery ML
The second option is to hook Strava as a data source into Google Data Studio, and then start building visualizations in Google Data Studio directly. This works because Google Data Studio allows to build custom connectors. I discovered on the web that such a connector already exists: I tried out r42 Activity Explorer for Google Data Studio, which took only six relatively straight-forward steps to install. I got it to work and its author Ralph Spandl suggested me to use the Extract Data connector in Google Data Studio in order to speed it up as it takes the Strava API a few seconds to return all activities. This is so far the quickest way to get a custom dashboard over Strava activities up and running.
The third option is a fully-automated daily export of Strava activities with Google Cloud Platform, and make Google Data Studio use BigQuery as a data source for visualizations. This is the approach I have chosen, and I will describe it later in detail. The benefit of this approach is that the BigQuery is fast enough to provide a snappy-enough dashboard, it gives me flexibility in future to access the Strava activities conveniently through BigQuery, and I can easily do some of the cleaning and transformations while ingesting the activities into BigQuery. Finally, I get a chance to learn how to use Google Cloud Platform!
The idea of exporting Strava activities into BigQuery is not new, so check out some of the articles that all describe with some variation on how to build an ETL pipeline getting activities from Strava into BigQuery:
- https://medium.com/@cyrille.bidon/explore-your-strava-data-with-gcp-469616905264
- https://medium.com/@dzagales/designing-a-fitness-leaderboard-in-gcp-a2d19d2bd0a2
- https://medium.com/slalom-data-analytics/a-personal-implementation-of-modern-data-architecture-getting-strava-data-into-google-cloud-49506446ebd4
How
How to build such an ETL pipeline, which takes the activities from Strava and loads them into BigQuery? As mentioned, there are multiple ways of doing this, but hey, one way is sometimes more than enough. Here is a rough diagram of how the data flows from Strava to BigQuery:
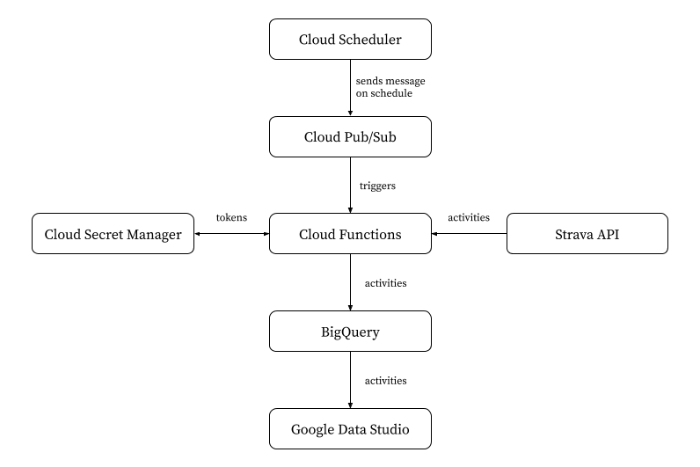
I used Cloud Scheduler in order to trigger the export on a daily basis by sending a message to a particular topic in Cloud Pub/Sub. Every such message triggers a small ETL pipeline on Cloud Functions, having three stages.
First, the extract stage of the ETL pipeline, still part of the Cloud function, uses access tokens and refresh tokens (see Strava on Authentication) stored in
Cloud Secret Manager in order to read all activities from the Strava API.
Second, the transform stage of the ETL pipeline stuffs the Strava activities obtained in the previous stage into a Pandas DataFrame. This allows me to conviently change units (e.g. I want distance to be reported in kilometers, not meters), and add columns such as geo location (in a format that Google Data Studio easily understands), weekend, or time of day (“morning”, “afternoon”, “evening, …). This, of course, introduces some tight coupling between the pipeline and its intended purpose for Google Data Studio. But since I built the whole pipeline with a single purpose in mind, that’s OK and keeps things simple.
Third, the load stage of the ETL pipeline materializes the activities into Cloud BigQuery using pandas-gbq. This is a single line of code, how convenient.
Finally, I used the standard BigQuery connector for Google Data Studio. Here are a couple of charts I built, just for illustration:
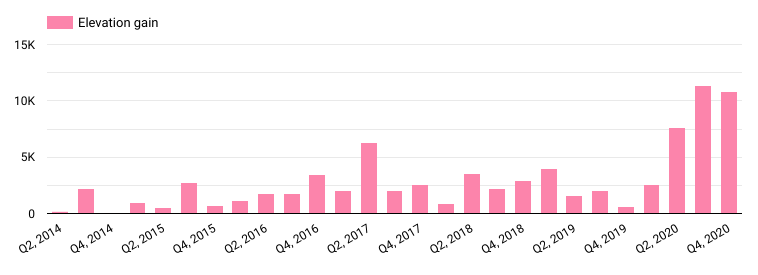
Elevation gain features more prominently since I moved from flat London to more hilly parts in Switzerland. I obviously noticed when I was out running, and I did not choose hilly running routes by accident, but I was nevertheless surprised about what a huge difference it made.
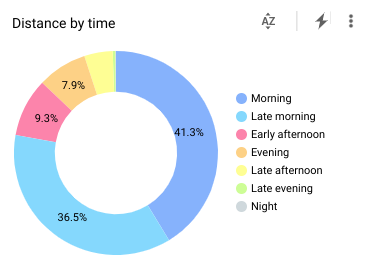
I am a morning person, also when it comes to sports. Of course, I already figured I was a morning person, but now I know that I start three quarters of my runs before noon.
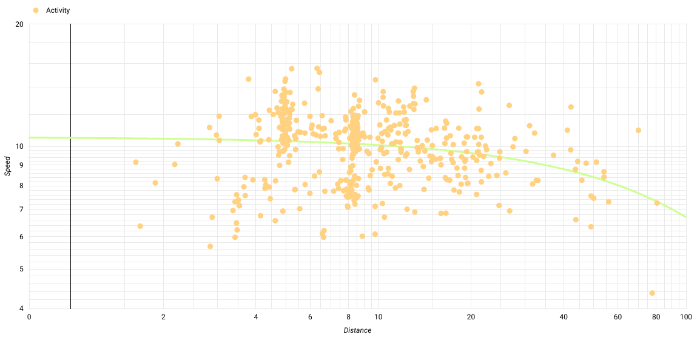
A log-log plot of distance versus speed for all my runs clearly shows outstanding performances during races as outliers, and clusters of activities (my run commutes in the past on ever-the-same route, or repeats of my local running route).
I hope you enjoyed this article as much as I enjoyed reading and trying out the prior work of other athletes / Strava users / visualization artists/ cloud developers.
There are a couple of caveats to note on my implementation:
- A more advanced solution would be to make Strava send a push notification and invoke the Cloud function whenever an activity is uploaded to Strava (possibly even implementing a streaming pipeline with batch size of one) but I spared myself the extra effort: there are only ever a few hundred or thousands activities, so batch size matters little, and freshness of the BigQuery data <24 hours is more than sufficient for my purposes.
- I have not build an explicit OAuth authorization flow, although it should not take too long: a small App Engine app would be sufficient as the target of a OAuth redirect, able to exchange the Strava code for access tokens and store them in Secret Manager.